1Univ.-Augenklinik, Freiburg, Germany
2Univ.-Augenklinik, Würzburg, Germany
Based on a poster at the ISCEV meeting 1997 in Asilomar. More detail in print:
• Statistical response/noise estimate Meigen T & Bach M (1999) On the statistical significance of electrophysiological steady-state responses. Doc Ophthalmol 98:207–232
• Fourier stuff: Bach M, Meigen T (1999) Do’s and don’ts in Fourier analysis of steady-state potentials. Doc Ophthalmol 99:69–82
[Note 10 years later: everything is still right ;-) but many modern FFT implementations to perform the DFT have dropped the power-of-2 requirement and computers became ≈100× faster.]
Fourier analysis is a powerful tool in signal analysis that can be fruitfully applied to steady-state evoked potentials (flicker ERG, pattern ERG, VEP etc.). However, there are some inherent theoretical assumptions in the discrete Fourier transform (DFT) that are not necessarily fulfilled in real-world applications. Furthermore, software packages developed for general engineering may be ill-suited and may not fully exploit the information of steady-state recordings.
Stimuli are periodic, and there is control over their frequency and absolute phase. This a-priori information can increase the power of the response measures as compared to textbook examples on Fourier analysis.
What we will ignore here:

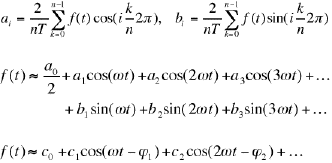
The discrete Fourier analysis/synthesis (DFT) formulas, which contain all the effects demonstrated below. The term “FFT” (“Fast Fourier Transform” describes a special rapid implementation to do the DFT. The “fast” aspect is a trivial methodical detail, eternalized by an “FFT” button on some commercialized equipment, and should be replaced by the generic term “DFT”, whether or not performed by an FFT. Furthermore, the FFT has a minor technical disadvantage (see below).
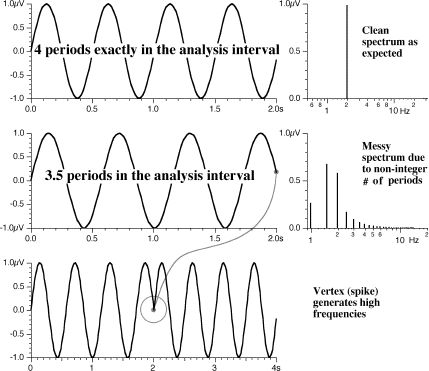
If the analysis interval comprises an exact integer number of stimulus periods (here 4), a sharp frequency will be found (top). However, if there is a non-integer number of stimulus periods (here 3.5), “overspill” into neighbouring frequencies will occur (center graph). Fourier analysis assumes periodic progression outside the analysis interval; the resulting vertex generates artifactal high frequencies (center and bottom graphs). As we know the stimulus frequency exactly, we can avoid this artifact. (When employing a raster-based CRT, the stimulus frequency has to be an integer divider of the frame frequency; Bach et al 1997.)
Thomas Heinrich recently spotted an error in this figure: For the lowest curve, I concatenated the wrong traces. Luckily, it doesn’t affect the conclusion. In the forthcoming paper [Bach & Meigen (in press) Do’s and don’ts in Fourier analysis of steady-state potentials. Doc Ophthalmol] this is corrected.
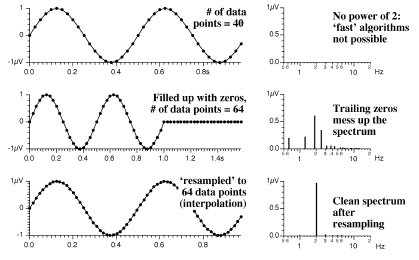
The experimental parameters principally determine the number of data points per sweep. This will often lead to an arbitrary number (e.g. 40, 200), not necessarily a power of 2 (e.g., 64, 128, 256, ...). However, the fast algorithms for the DFT need such a number (FFT by Coley & Tokey 1965; FHT (Fast Hartley transform), O’Neill 1988). Textbooks suggest to fill up with zeros. This plays havoc with the spectrum of periodic data (center graph). An easy solution is to ‘resample’: Interpolation to the next higher 2n number of data points (bottom graph). This can be done with linear or non-linear interpolation. A very small amount of spurious frequencies will be generated that can be neglected against other noise sources.
As an alternative to FFT/FHT, one can use straight numerical integration procedures to determine the Fourier coefficients, these methods do not require power-of-two data points. Typical flicker-ERG, PERG or VEP sweeps will have less than 1000 data points, so a numerical integration to calculate the Fourier coeffiecients will only take milliseconds on current computers. To calculate the entire spectrum, however, the calculation time will be noticable.

Often records will show a “trend”, a slow upwards or downwards shift of the sweep (see “PERG, 16 rps” in the adjacent figure).
This can be caused by electrode drift or through the following mechanism: After eye blinks, there will be a huge offset on the signal, and the averager rejects the sweeps until the baseline enters its acceptance windowwith a speed determined by the time constant (or highpass setting) of the amplifier. Then averaging is resumed, but the baseline still drifts toward zero, causing the “trend”.
When a Fourier analysis is performed on such records, the trend will cause a typical “sawtooth spectrum”: The Fourier analysis assumes that the analysis interval repeats periodically and thus sees the trend as a sawthoot waveform with its typical spectrum (every harmonic present with diminishing amplitude).
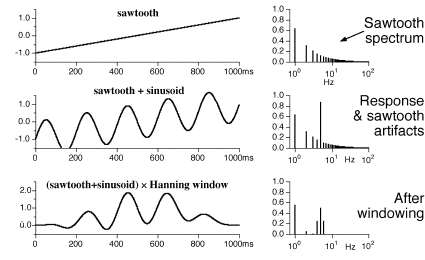
Textbooks suggest to “window” the data. This makes sense because it reduces somewhat the influence of overspill due to a non-integer number of responses per analysis interval (see “overspill” above); it also reduces the “sawtooth” or trend artifacts (see previous paragraph).
The neighbouring figure shows that indeed many lines from the sawtooth spectrum are suppressed through windowing. But note also that the line at 1 Hz remains. Furthermore, new lines are created adjacent to the response (“overspill”).
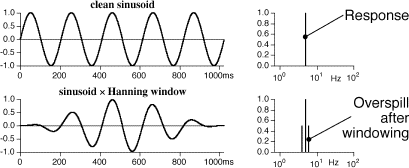
Windowing generally leads to overspill near the response frequency. This is here more clearly shown: At the top there is a “clean” sinusoid with a corresponding single line in the spectrum. After windowing (bottom), adjacent lines (so called “overspill”, “leaking” or “sidebands”) occur. This is an unavoidable consequence of the modulation of the signal by windowing.
When (as in evoked responses) the stimulus frequency is known exactly, windowing is not necessary and trend artifacts can be otherwise dealt with (see above).
A high number of stimulus periods per analysis interval allows to recognize “trend artifacts” that may arise from blink rejection and electrode drift. A linear trend will generate a sawtooth-spectrum (see above). If the response frequency is high as compared to the lowest possible frequency (representing the fundamental of the sawtooth), the response will not be markedly affected by sawtooth harmonics. If there is only one response period per sample interval, the entire low frequency noise will “fold” into the response frequency.
Increasing the sweep length thus has two advantages:
A long sweep duration has one major disadvantage, though: If the seep needs to be rejected due to a blink artifact, too much valuable recording time is lost.
As a compromise between number of averages and sweep length (keeping total recording time constant) we suggest to choose about 8 responses per sweep.
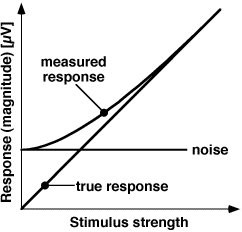
Noise and true response (magnitude in the frequency domain) do not add linearly (Strasburger 1987, Norcia et al 1989).
Bad news: small amplitudes will likely be noise only. Good news: if the amplitude is ~3x the noise estimate, there is virtually no noise in that line.

The signal-to-noise ratio SNR can be estimated either by the tCIRC statistic (Victor & Mast 1991), or by comparing the response frequency with the average of neighbouring frequencies (Meigen & Bach 1999). When the analysis interval is selected appropriately (no overspill, see above), the immediate neighbours do not contain any response and good estimators of the response at the response frequency.
We calculated the effects analytically (Meigen & Bach 1999) and provide the following rule of thumb for significance of the response:
| SNR | p |
|---|---|
| 2.0 | 0.12 |
| 2.8 | 0.05 |
| 3.0 | 0.04 |
Discrete Fourier analysis (DFT) can greatly enhance analysis of our results. As we have much a-priori knowledge about the signal in evoked potentials, we can:
Addition 2005-05-14: there is a nice demo of Fourier analysis/synthesis at Dan Russel's website
→More “on-line papers”